Overview
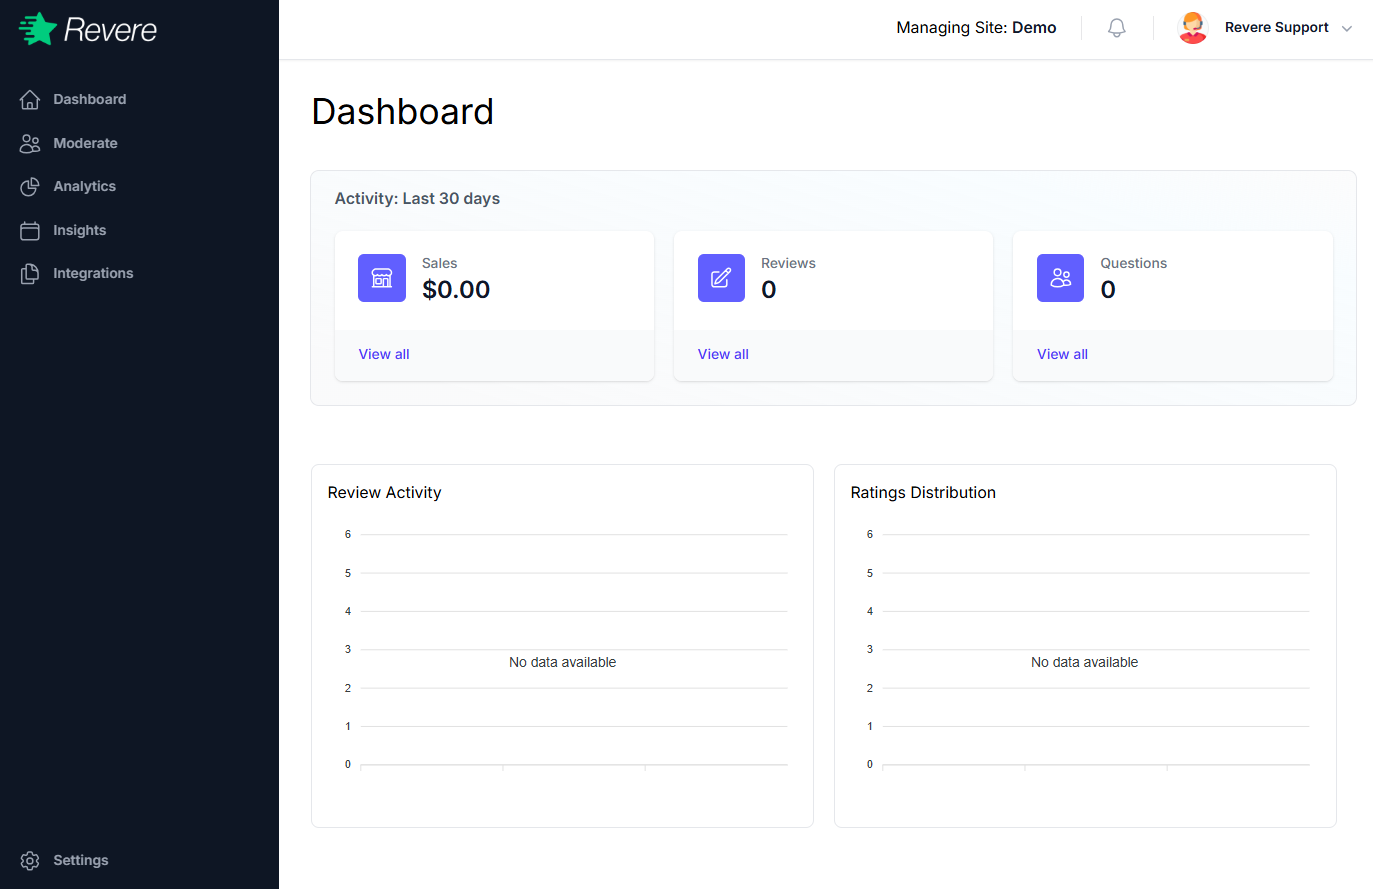
When you log in to Revere, the Dashboard is the first screen you'll see. It provides a quick summary of your store's review activity over the past 30 days.
Activity Summary
The top section shows three key metrics for the last 30 days:
Total order revenue attributed to review-influenced purchases over the last 30 days.
The number of new product reviews received during this period.
The number of new customer questions submitted through the Q&A widget.
Each metric shows a View all link that takes you directly to the relevant list in Moderation.
Review Activity & Ratings Distribution
The lower portion of the dashboard shows two charts:
-
Review Activity — A timeline chart showing when reviews were submitted over the past 30 days. This helps identify spikes that may be related to a promotion, product launch, or external mention.
-
Ratings Distribution — A bar chart showing the breakdown of reviews by star rating (1–5 stars). A healthy store typically shows a heavy concentration in the 4–5 star range.
If your charts show "No data available," you likely haven't received any reviews yet. Start by installing the Revere widget on your store — see the Install Guide.
Managing Site
The top bar shows which store you're currently managing under Managing Site: [Store Name]. If you manage multiple stores, click the site name to switch between them without logging out.